During the debate, Paul Ryan ‘addressed’ the Tax Policy’s assessment that the Romney Tax plan’s math doesn’t add up (he claims he’ll cut taxes across the board, and that this plan will be revenue neutral because it will make up the difference by closing loopholes–the problem is that this only works if those tax loopholes include tax credits for middle income earners, who would in effect see their tax burden increase) by citing 6 studies that supposedly negate the study. The only problems is that these ‘studies’ are really a collection of blogs posts, articles and best off all, a draft written by Romney’s own campaign. Sadly, this is what passes for policy debate these days, and it’s overwhelmingly Republicans who are stuck on the wrong side of analysis provided by non-partisan sources (and subsequently have to rely on partisan players as reference).
Many Republicans forcefully argue that the Heritage Foundation is a non-partisan organization. But the fact is, that this organization has a pre-ordained agenda and their studies are nothing more than an ongoing (and well-funded) study in confirmation bias. The conclusion of their studies are decided in advance. The premise decides the conclusion which then supports the premise.
Founded in 1973, The Heritage Foundation is a research and educational institution—a think tank—whose mission is to formulate and promote conservative public policies based on the principles of free enterprise, limited government, individual freedom, traditional American values, and a strong national defense.
Partisan, according to the Merriam-Webster Dictionary
: not partisan; especially : free from party affiliation, bias, or designation
Now, one could argue that the Heritage Foundation is non-partisan because it doesn’t endorse a specific party. However, it’s clear that they are a clearinghouse for studies that promote a specific ideology. The answer is always “less government” and so magically, they will always defend the sort of tax plans that lean in this direction. And because Republicans generally claim they want to reduce the size of government, the Heritage Foundation naturally favors their policies over those of Democrats. What they should not be confused for is an objective think tank whose sole mission is to crunch numbers and churn out objective data. The Tax Policy Center is more along the lines of such and private sector agencies like Moody’s Economy have a business model that relies on being known as an objective source. And here is what Moody’s Economy’s Chief Economist has to say about Romney’s Tax Plan:
In fact, Moody’s Chief Economist has has positive things to say about the American Jobs Act (which Republicans have blocked for 13 months now).
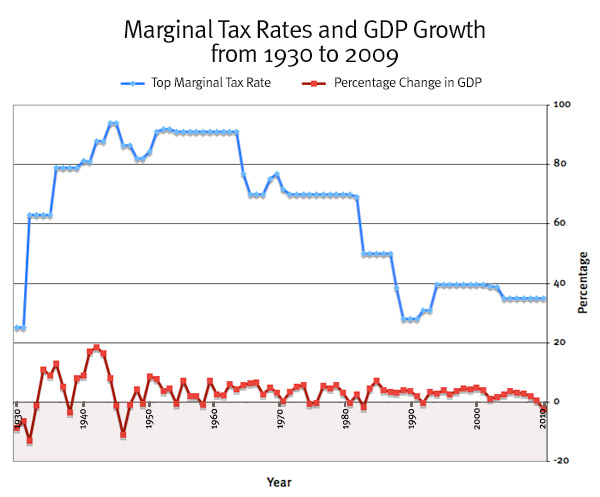
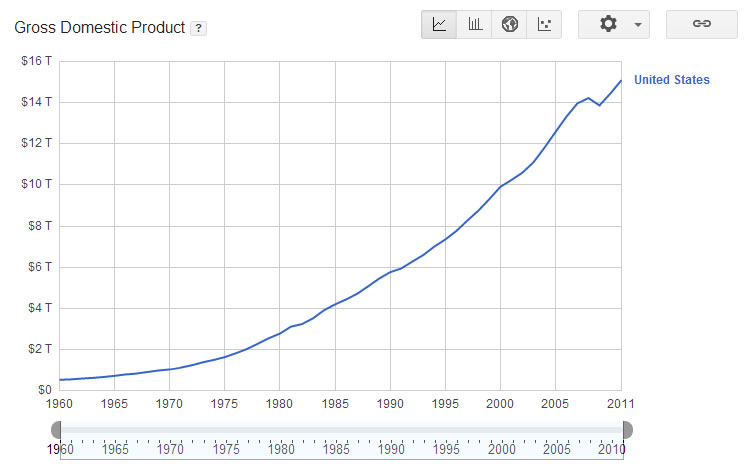
Paul Ryan (and other Republicans) often allude to the past to show that their tax cuts supposedly led to subsequent growth. The problem is that our GDP has ALWAYS grown, with or without a tax cut.
The above graph is important for various reasons, not the least of which because the flaw behind so many Republican talking points (if not the bulk of their economic policy) becomes obviously once you realize the economy is always growing
- Many Republicans will cite a tax cut and “show” subsequent GDP (or revenue) growth as if that specific policy caused it
- Ron Paul and his followers blame everything on the Federal Reserve and inflation (a natural part of a growing economy) as if this trend somehow started with the Federal Reserve
- The rhetoric regarding our “historic debt” fails to take our “historic size of GDP” into account and fails to adjust this monetary value for inflation ($1 today buys you “much less” than it did $30 years ago. For example: the minimum wage in 1968 was $1.60, which would amount to roughly $10-$11 in today’s dollars).
It’s important not to let the graph above fool you into believing the economy is actually growing faster and faster. As the economy gets bigger, the same rate of growth will make it seem like it’s growing faster and faster because sheer incremental growth represents more in growth. A growth of 2% in an economy of $500 billion and 2% in an economy of $12 trillion look different on a static chart like the above. Below, you can see the rate of growth (and how GDP hasn’t grown any faster as taxes on the wealthiest Americans have been cut to a fraction of what they were during the post WW2 boom).


